



The goals in your projects cannot freeze to death! We prepared this article to show you how the KPI method can keep your strategies "warm."
After planning sessions held in team meetings, people walk out "wearing" their goals and their respective task lists, and head off to execution.
However, it is common for the plan to cool off as each person drifts away from the project's real goals because of their own duties, opinions, and — above all — lack of follow-up.
It is during this cooling-off process that goals can die along the way, because they are not "warmed up" with the attention they deserve.
KEEP ON TRACK!
This drift happens because the goals never go through measurement and monitoring processes. It is through these follow-up methods that goals are diagnosed, in order to keep them on track whenever necessary.
In this article, we will cover a very simple and friendly method for diagnosing your project's goals. It is called KPI — Key Performance Indicators.

This is a KPI analysis template in .xlsx format adapted for tracking processes, objectives, and targets. This article explains why and how to use it:
WHAT IS THE KPI METHOD?
The purpose of a KPI is to represent the performance of a given process and show whether it is meeting the defined goals. It can be expressed as a number or a percentage.
SO IS A KPI THE SAME THING AS A METRIC?
Basically:
Metric = points to results and numbers (data)
KPIs = quantify the performance of processes against the goal, without necessarily establishing a number as the result, but rather a tracking percentage
For example, running an analysis to find out the number of complaints recorded per month (April recorded 100) — that is a metric, and from it you can identify a pain point.
A KPI, on the other hand, analyzes and quantifies the progress of processes through charts or percentage results, providing a more managerial and detailed view of how goals are advancing.
Download our e-book here on how to turn customer complaints into opportunities.
HOW DO I APPLY A KPI TO MY PROCESSES?
First, download our analysis template (.xls — Excel) and follow the explanations below:
There may be hundreds of other ways to measure the progress of goals, but we will focus on these three types of key performance indicators (KPIs), which can already evaluate your plan's goals effectively.
Let's suppose the goal being analyzed here is:
GOAL 1: Increase the number of consumers of the company's products.
TARGET: 200 new consumers/month
For this goal, we then have the following KPI analysis board:
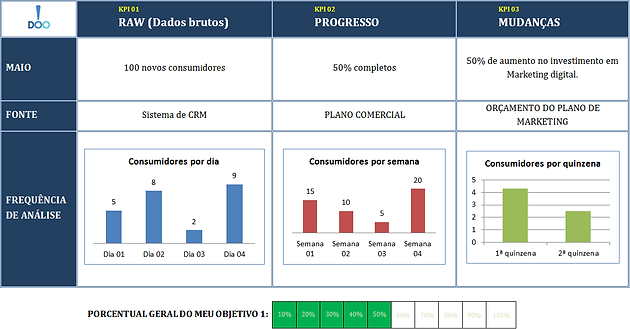
UNDERSTANDING THE BOARD:
THE 3 KPIs: We defined three basic ones, but you can establish as many as you find necessary.
RAW (Raw data)
This is the first KPI. It corresponds to the actual value or status you have at the moment.
PROGRESS
This second KPI should be measured as a percentage, and its purpose is to indicate how the analyzed item (RAW) is advancing toward the process goal/target.
CHANGES
In this third KPI, you should record, in more detail, the progress of each change expected as a result of meeting the goal in question.
Remember that the KPIs you define are not the GOALS of your plan. They actually serve as pointers to the fulfillment of those goals, ensuring that the processes are executed.
WHAT IS THE DATA IN THE LEFT COLUMN FOR?
You will notice that below the 3 KPIs, in the left column, we set up some supporting indicators to make your KPI more complete. They are:
MAY
In this field you enter the month (or week) in which the RAW data was analyzed. In the template we made available for download, you simply change the month manually.
SOURCE
To give your research a solid foundation, this field is used to state the source from which you collected each KPI. For example:
- Where did you collect the RAW data from?
- Based on what criteria can you judge that your PROGRESS is currently 50%?
- Where, or from whom, did you get the data showing the CHANGES driving progress?
FREQUENCY
It simply quantifies your research, presenting real data per period. The chart data is living proof that your final percentage is correct.
You will notice that below the key indicator types, we set up some supporting indicators to make your KPI more complete.
With this material you will be able to put your process goals to the test so they never cool off — and, consequently, never die. Controls like these keep your plans healthy.
We hope this content helps you achieve more accurate and reliable management.
Leave your opinion in the comments!
Originally published in Portuguese at useall.com.br.